Triton—More than an Apex logging framework
If you haven’t heard, there’s a new Apex logging framework.
Logging frameworks in APEX have become very popular over the last few years. I still remember when it was a cool thing to create a custom object to log exceptions. It was something that cool developers did. Nowadays, the most popular Apex logging framework is NebulaLogger, which is indeed powerful.
Today, I want to talk about a new free and open-source framework that has risen: Pharos Triton. This framework was created by the team behind Pharos. I had the opportunity to give this logging framework a try; I really liked it and wanted to share my experience with it so far.
At a high level, what I like about this logging framework is that it is more than just a logging framework. I don’t mean to say that logging frameworks are not useful or incomplete. However, on top of being a traditional logging framework, Triton provides a lot of functionality around dealing with the logs once they are created. If you think about it, Apex logs are only a means to an end. The only reason we log Apex exceptions to a custom object is so that we can react to them later, inspect them, and maybe decide what to do with them.
And that’s where Triton shines. There’s a lot of functionality to help you understand the consequences in your Salesforce org of certain exceptions in your codebase; how to action them, what to do with them, how often they happen, and what the impact is.
In a way, this product bridges the gap between simply logging Apex exceptions and doing something useful about them.
How to log messages and exceptions
Logging messages and exceptions with Triton is as simple as you’d expect, here’s an example
public void basicApexLogging() {

      Triton.instance.startTransaction();

	    Triton.instance.debug(TritonTypes.Type.Backend,
			TritonTypes.Area.Accounts,
			'Apex logging example Pre-dml',
			'Pre dml update. Processing account records');


	try {

		List<Account> accounts = [SELECT Id, Name FROM Account LIMIT 1];
		if (!accounts.isEmpty()) {

			Triton.instance.debug(TritonTypes.Type.Backend,
					TritonTypes.Area.Accounts,
					'Account records found!',
					'Pre dml update. Processing account records');

			accounts[0].Name = 'Logging rules!';
			update accounts;
		}

        DmlException e = new DmlException();
        e.setMessage('woops');
        throw e;

	} catch (Exception e) {

		Triton.instance.error(TritonTypes.Area.Accounts, e);

	} finally {
		Triton.instance.stopTransaction();

	}
}
Let me call out a few things. First, we can specify the technical and business area that a log belongs to, for example
Triton.instance.debug(TritonTypes.Type.Backend,
			TritonTypes.Area.Accounts,
			'Apex logging example Pre-dml',
			'Pre dml update. Processing account records');
Here, we are saying that this log was captured in the backend (as opposed to LWC, the frontend) and that it belongs to the Accounts domain or functional area. This is already evidence that more than simply logging a message, the framework understands that we need more context around it if it is to become useful.
Once messages are logged to the custom object, we can use standard Salesforce list views and reports to see all messages by functional or technical area. Again, this is a nice way to bridge the gap between just logging and making sense of things.
Also, all the logs are grouped together under a single transaction using Triton.instance.startTransaction and Triton.instance.stopTransaction. A really nice feature is the ability to make a single transaction span multiple Apex transactions using resumeTransaction(String transactionId). We can use this method to tie together different Salesforce transactions into a larger transaction.
Finally, you can log error messages or exceptions using Triton.instance.error(TritonTypes.Area.Accounts, e).
Inspecting the logs
Once the messages or errors are logged, I can inspect them from the Logs tab in the Pharos app in my Salesforce org. Here’s what a log looks like
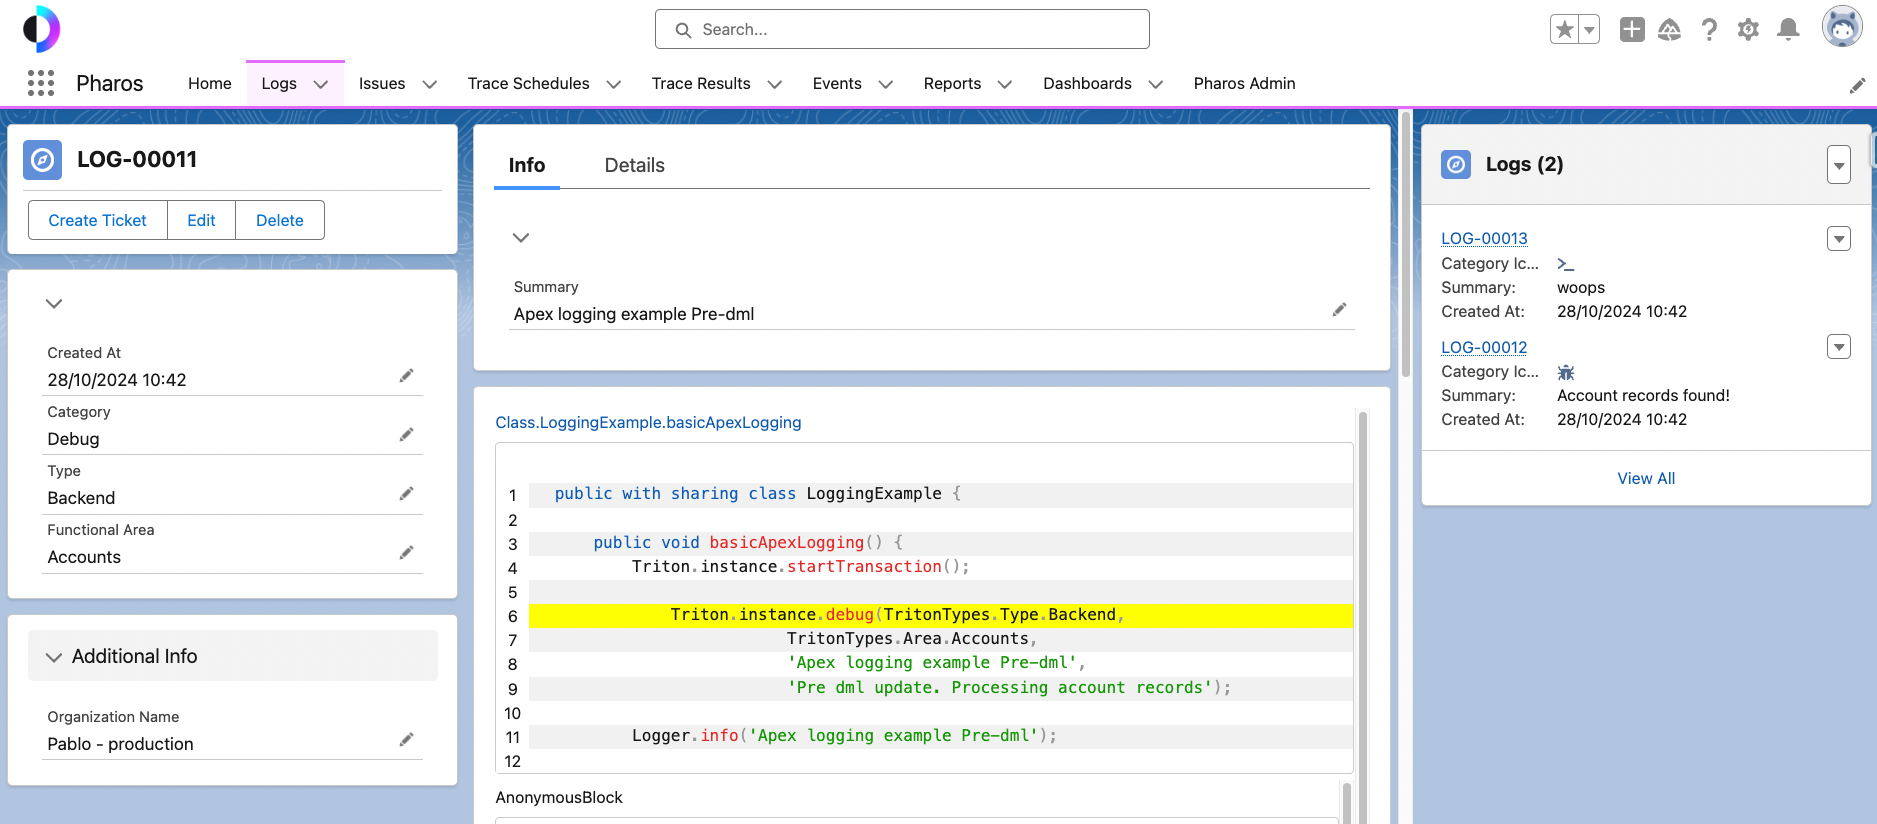
Immediately, I really like that I can see exactly where the log originated from. This saves me from having to look at the stack trace, locate the Apex class and find the specific line of code. It also makes this information available to others you may not know how to use VSCode or other developer tools.
To the right, I can see all the child logs that were logged during the same transaction. And to the left, I can see that this belongs to the Accounts functional domain.
What I really like is that if you log an error, Triton automatically creates an Issue for you. For example
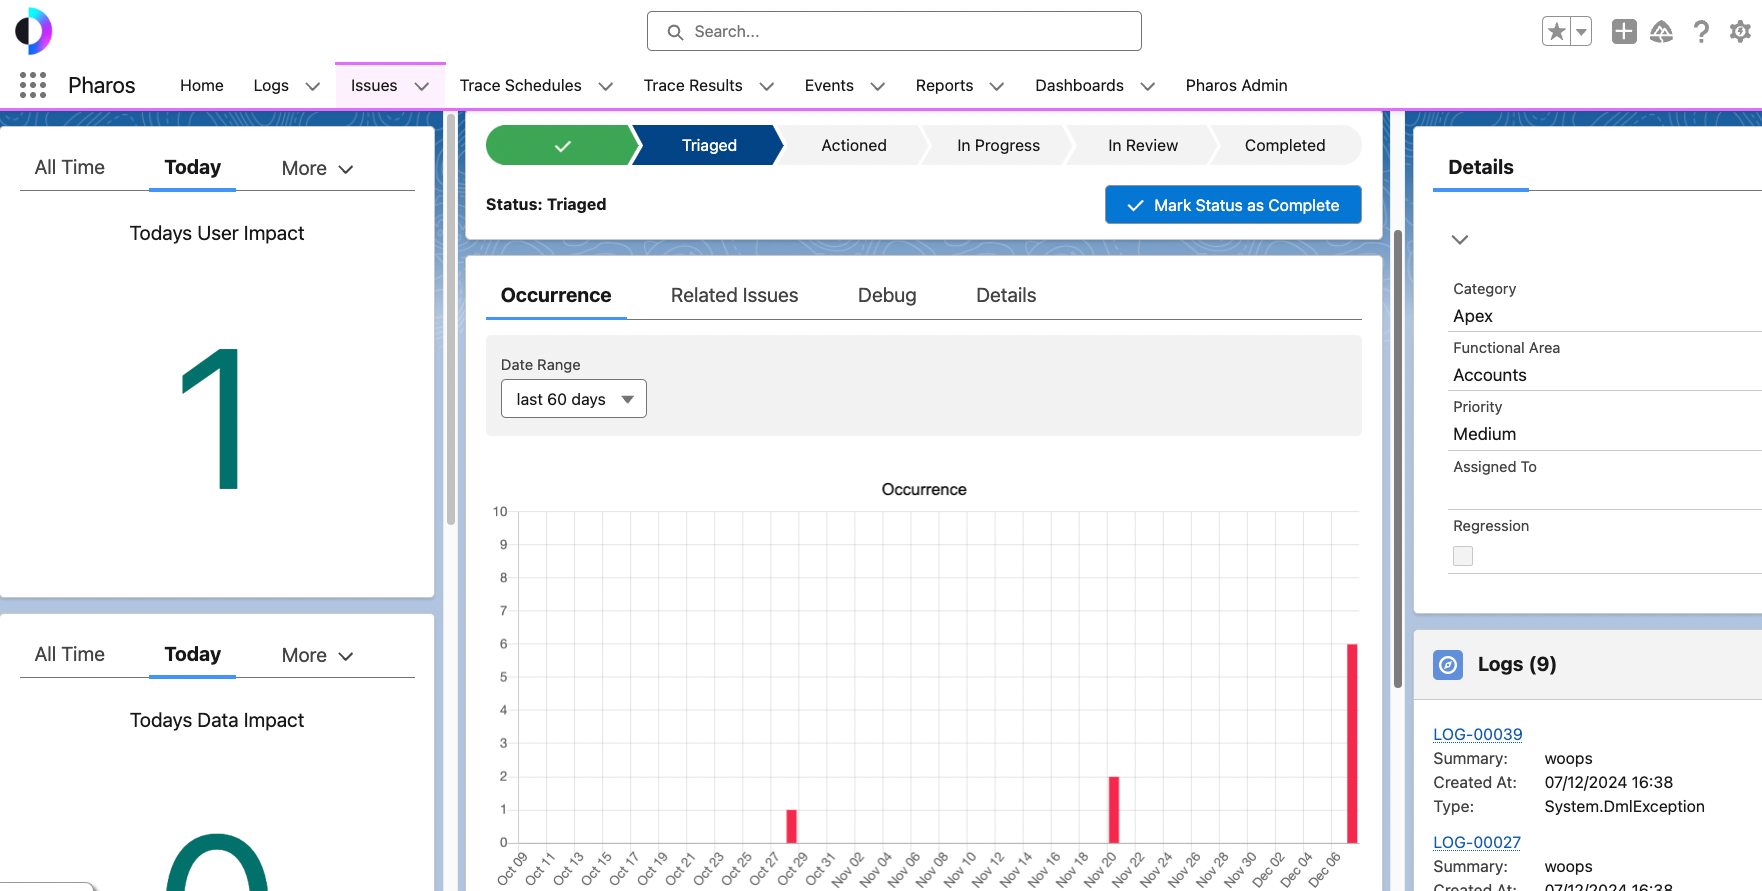
And in this issue I have access to way more insights than I would expect from a traditional Apex logging framework. I can see how many times the issue has occurred today, how many times it’s happened in the last 60 days and I can also set a status (triaged, in progress, etc.). This to me is the real differentiator. I can actually do something with this and work with my team to figure out why a particular error keeps occurring.
Cross transaction logging
Another really cool capability is you can trace a single log across multiple automations spanning LWC, Flows and Apex. This is done by passing a transaction ID across automations using built-in Triton methods.
The end result is you can see an entire business process in a single log
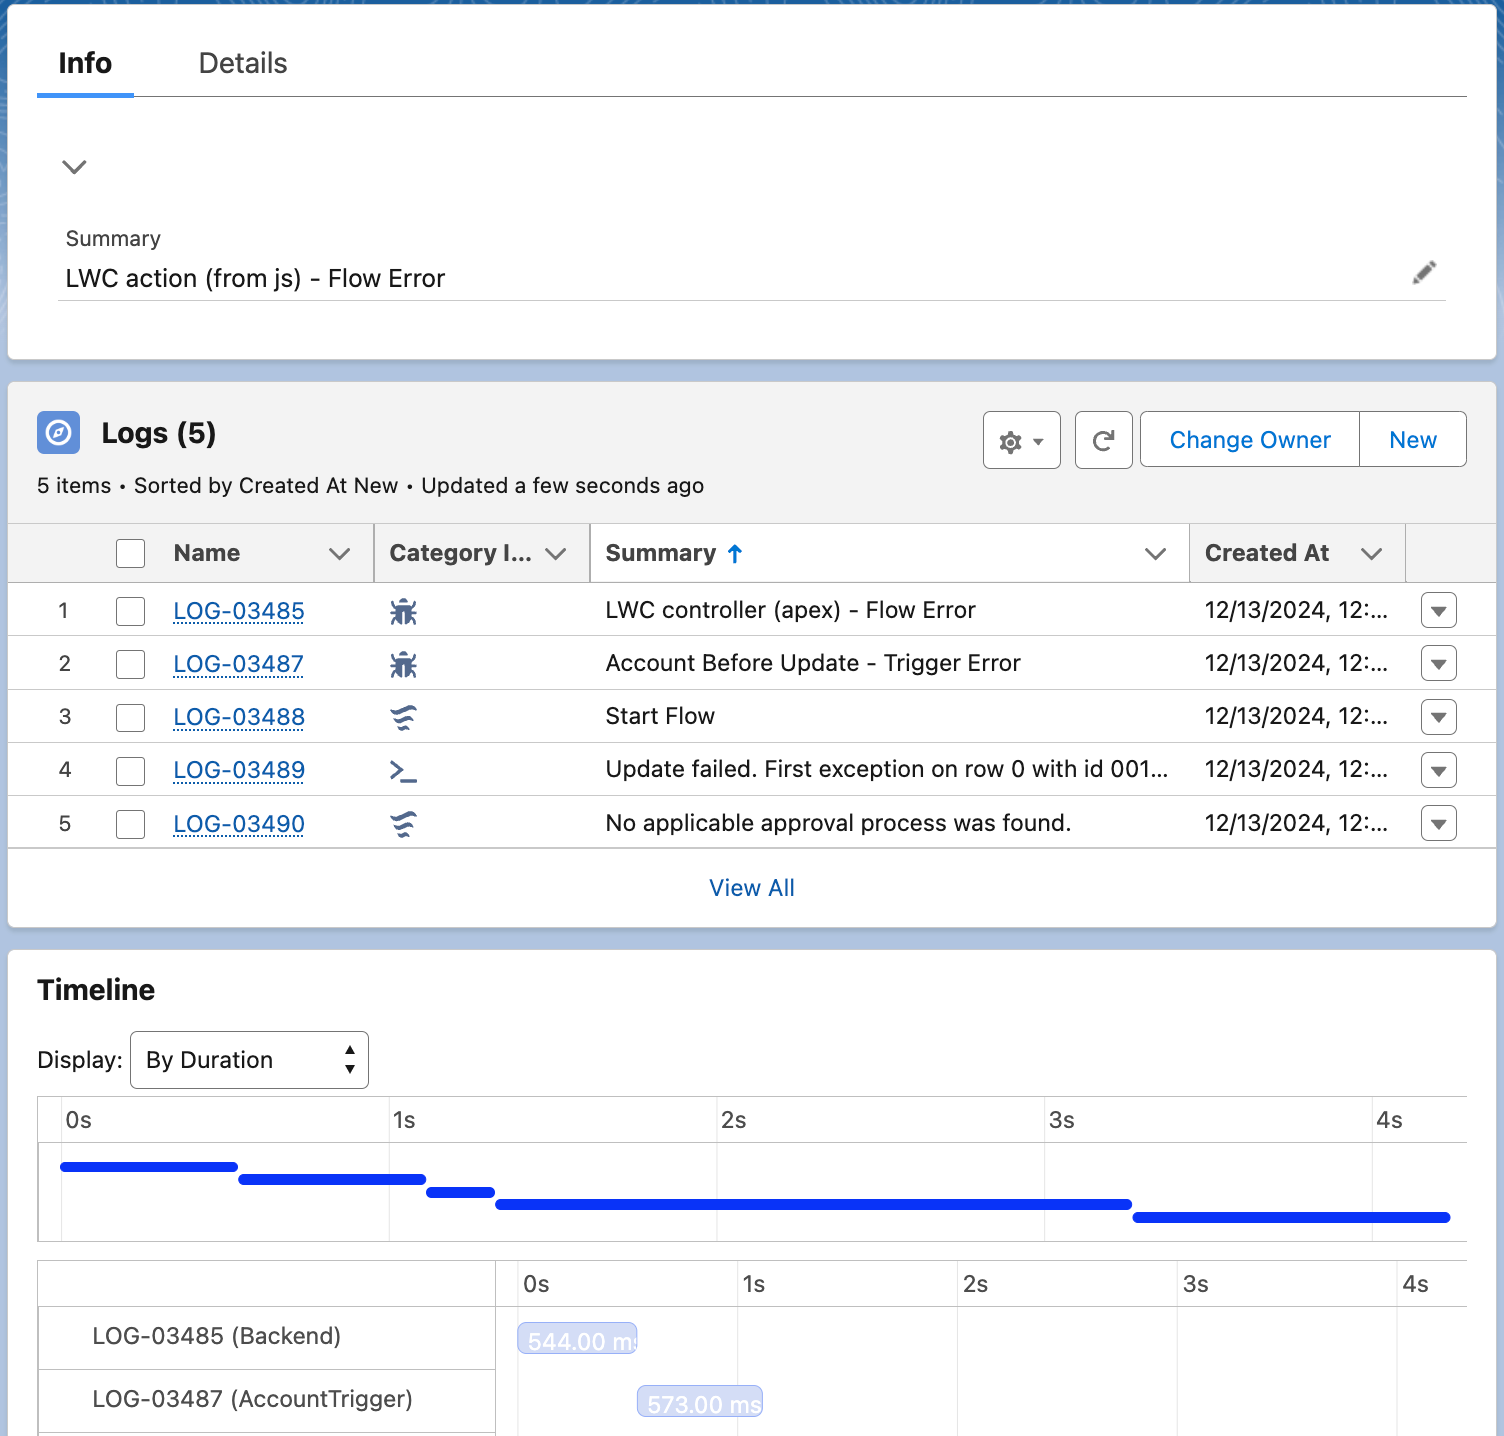
This is 100% betters than running multiple debug logs in different contexts and trying to understand how they fit together.
My favourite feature: HTTP Logging
By far my favourite feature is the capabilities for HTTP logging. Troubleshooting HTTP errors in Apex has always been a drag and typically involves adding a lot System.debug statements to see what is going on. With Triton, logging an HTTP error is very simple
request.setHeader('Content-Type', 'application/json; charset=UTF-8');
        request.setEndpoint('<https://jsonplaceholder.typicode.com/posts>');
        request.setMethod('POST');
        request.setBody(getBody());

        try {

            HttpResponse response = http.send(request);

            //imagine there was an error
            if (response.getStatusCode() == 201) {
                Triton.instance.integrationError(
                    TritonTypes.Type.Integration, /* type */
                    TritonTypes.Area.OpportunityManagement, /* area */
                    'This API is not available!', /* summary */
                    'The API is not available, please try again later.', /* description */
                    request, /* HttpRequest */
                    response /* HttpResponse */
            );
            }
But what is really mind-blowing, is the fact that the request and payload are automatically logged to the error log object, and you can replay the request right from there!
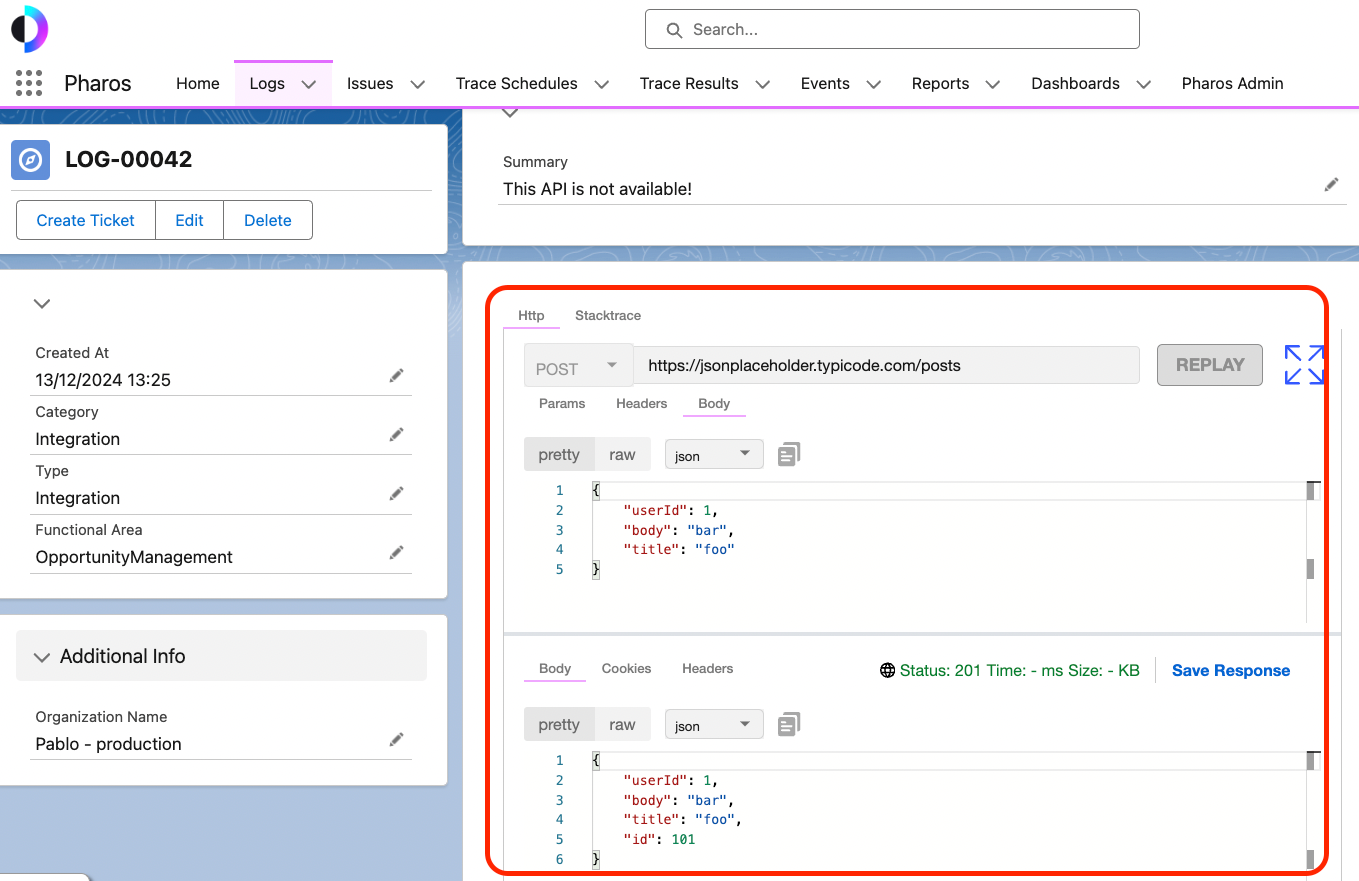
This looks and behaves very similar to Postman, which makes troubleshooting even easier for those familiar with it. If you reply, the callout is made from Apex, which ensures you are replying the behaviour with the correct context.
Aside from being an awesome feature, I’m surprised with how much thought the Triton team put into what would normally be considered an edge case.
Configuration
Beyond being able to log errors and get insights, Triton is highly configurable. I found the setup UI extremely easy to follow and I was able to configure many settings without reading the docs. Here are a few examples:
Slack alerts
I was able to configure Slack alerts in a few seconds. I was honestly surprised how it “just worked” given my past experience dealing with the Slack API.
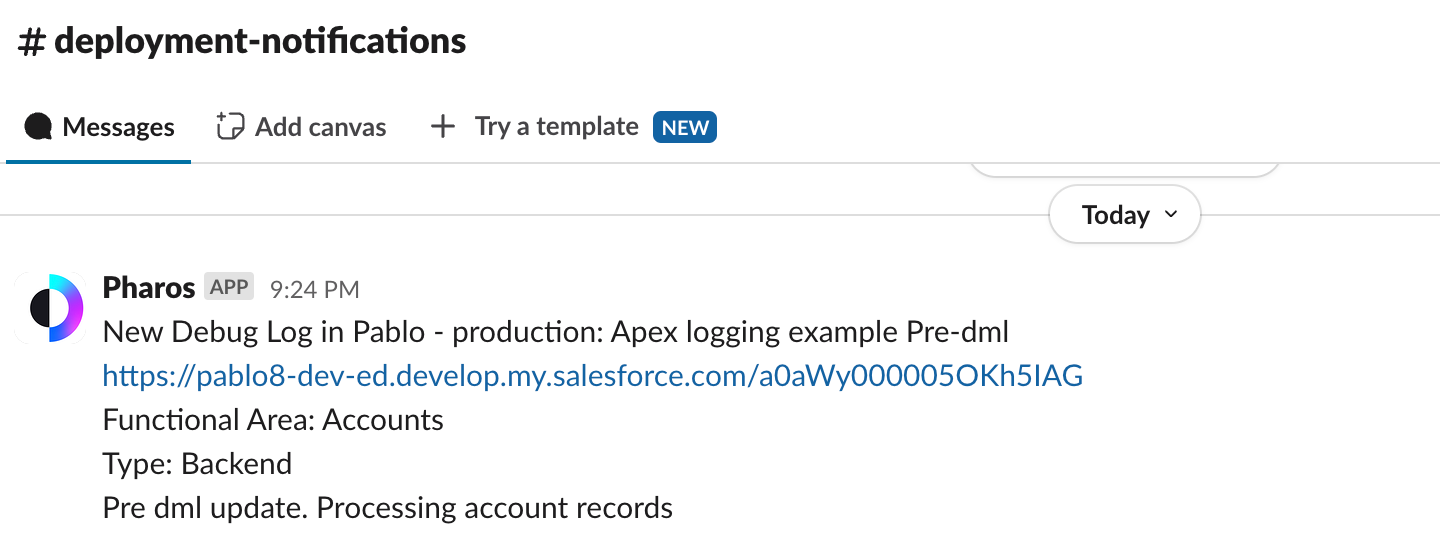
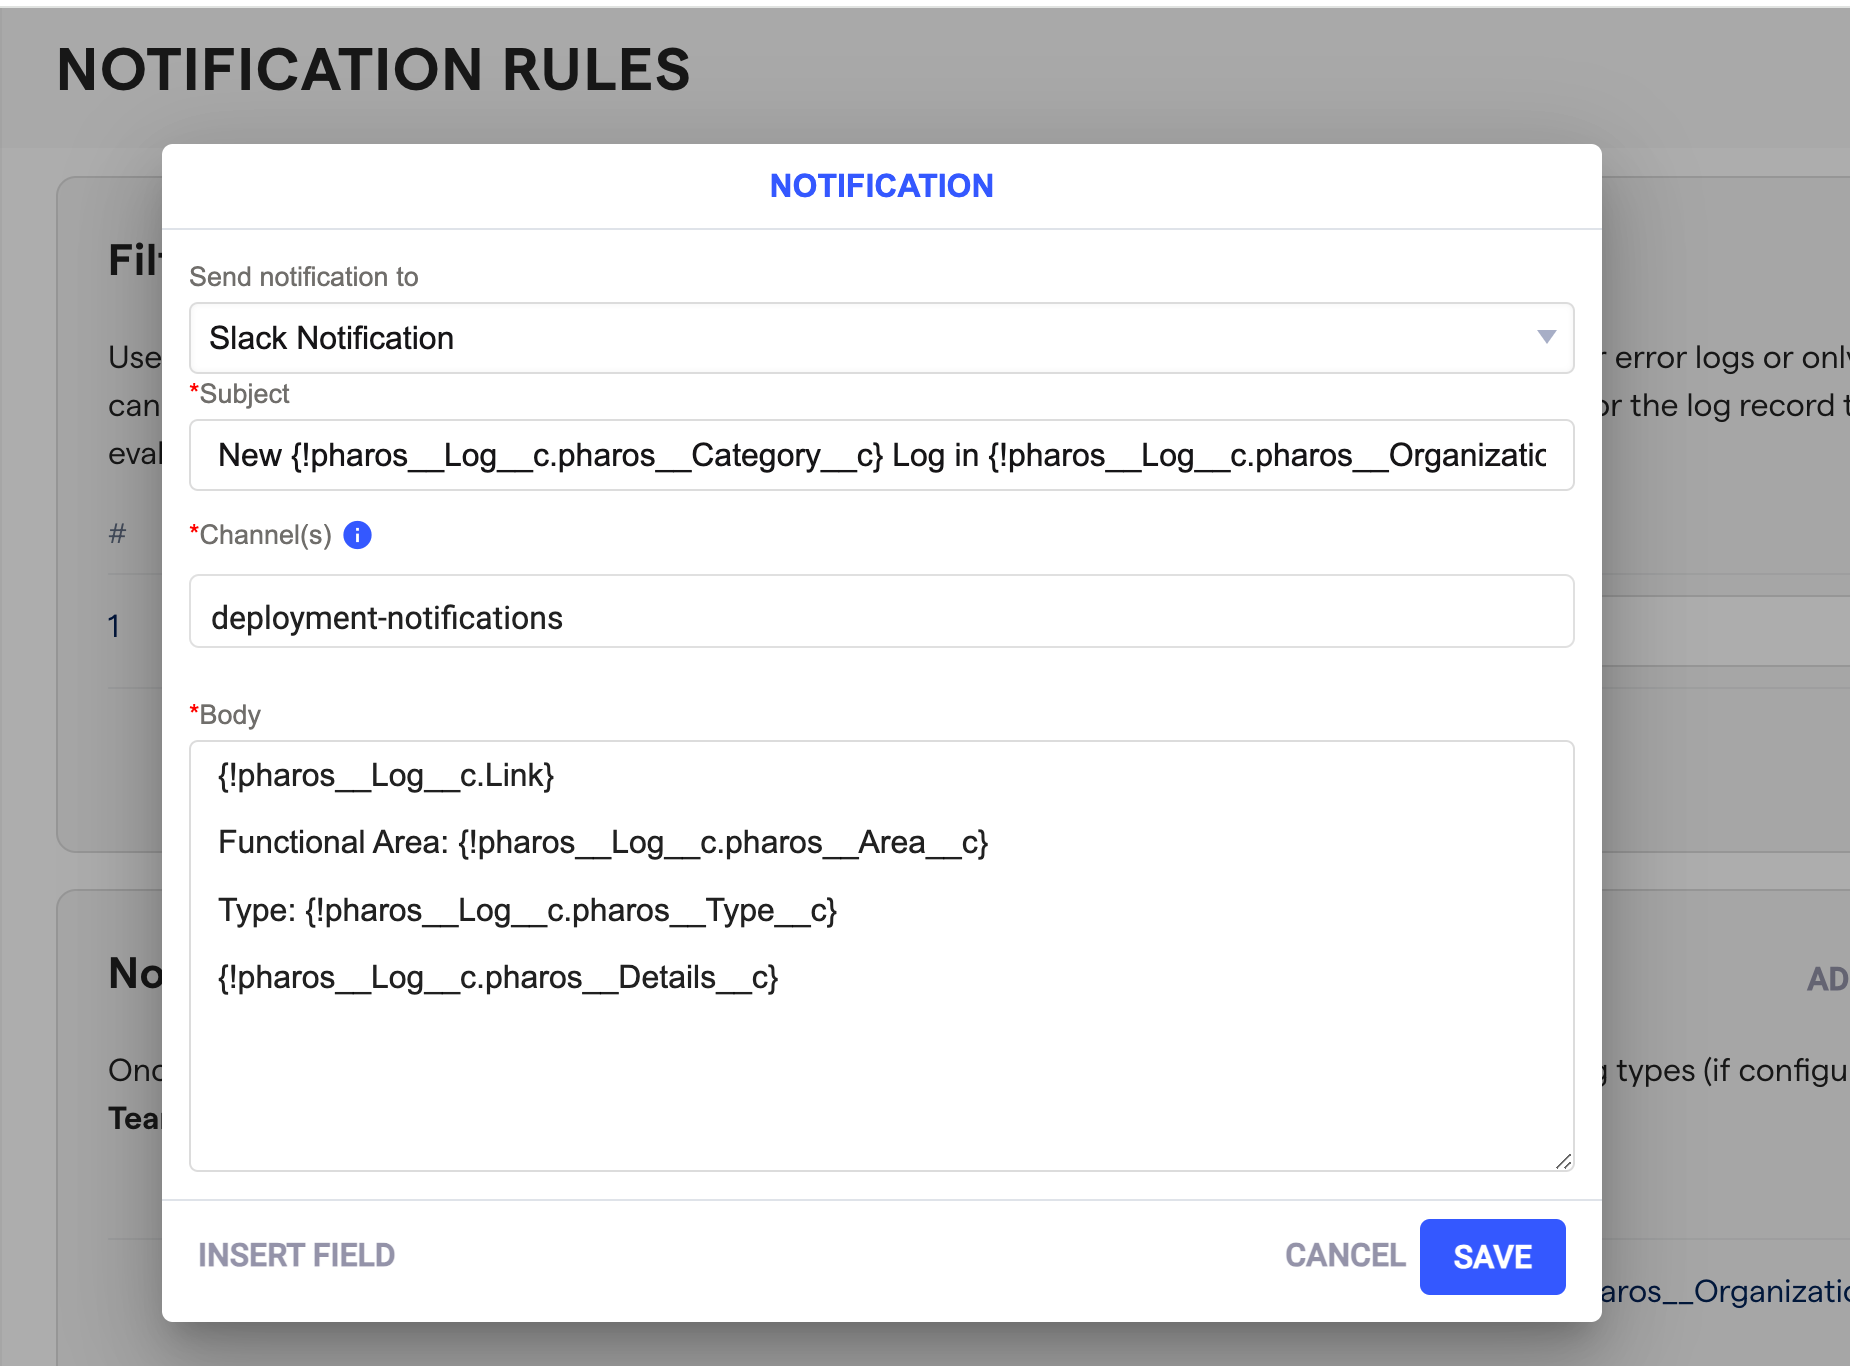
You can also fully customise the alert itself
Data retention
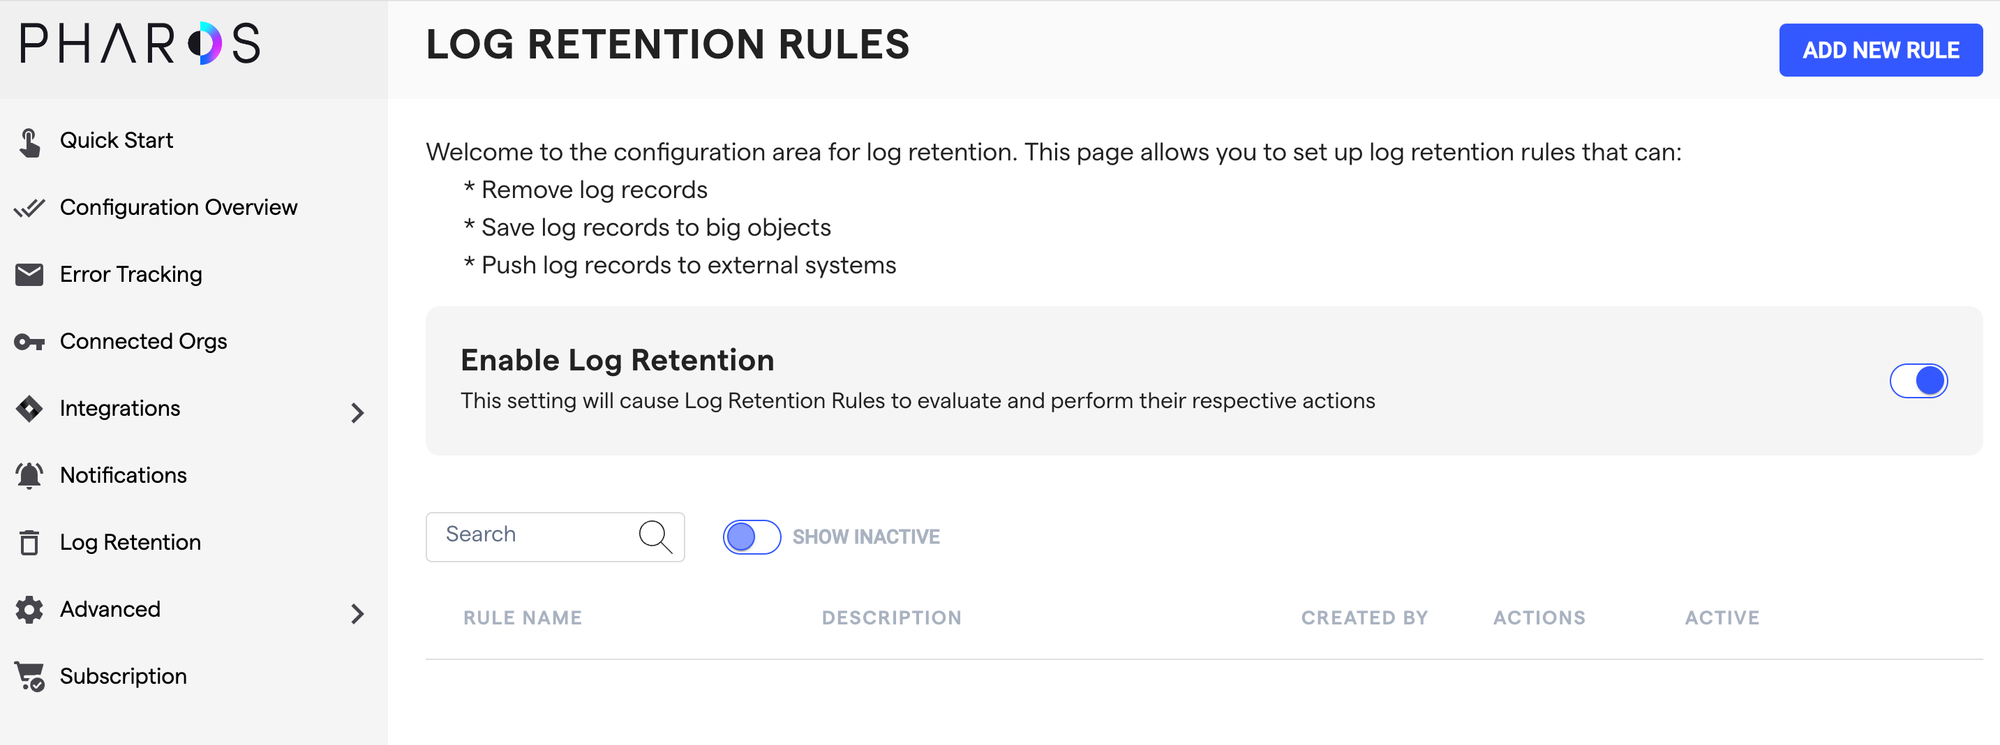
There’s also a way to configure how long log records stay in your org. You do this by configuring rules which is great because it means you can archive logs differently depending on the type or severity of the log.
Data masking
Another important part of logging is to not expose customer information or PII in the logs. To be honest, this is a concern I had actually never thought of 🙂
Triton makes it very easy to configure data masking rules using simple regex expressions. In the rule below, I specify that the word “Pablo” shouldn’t show up on the logs and thus should be masked.
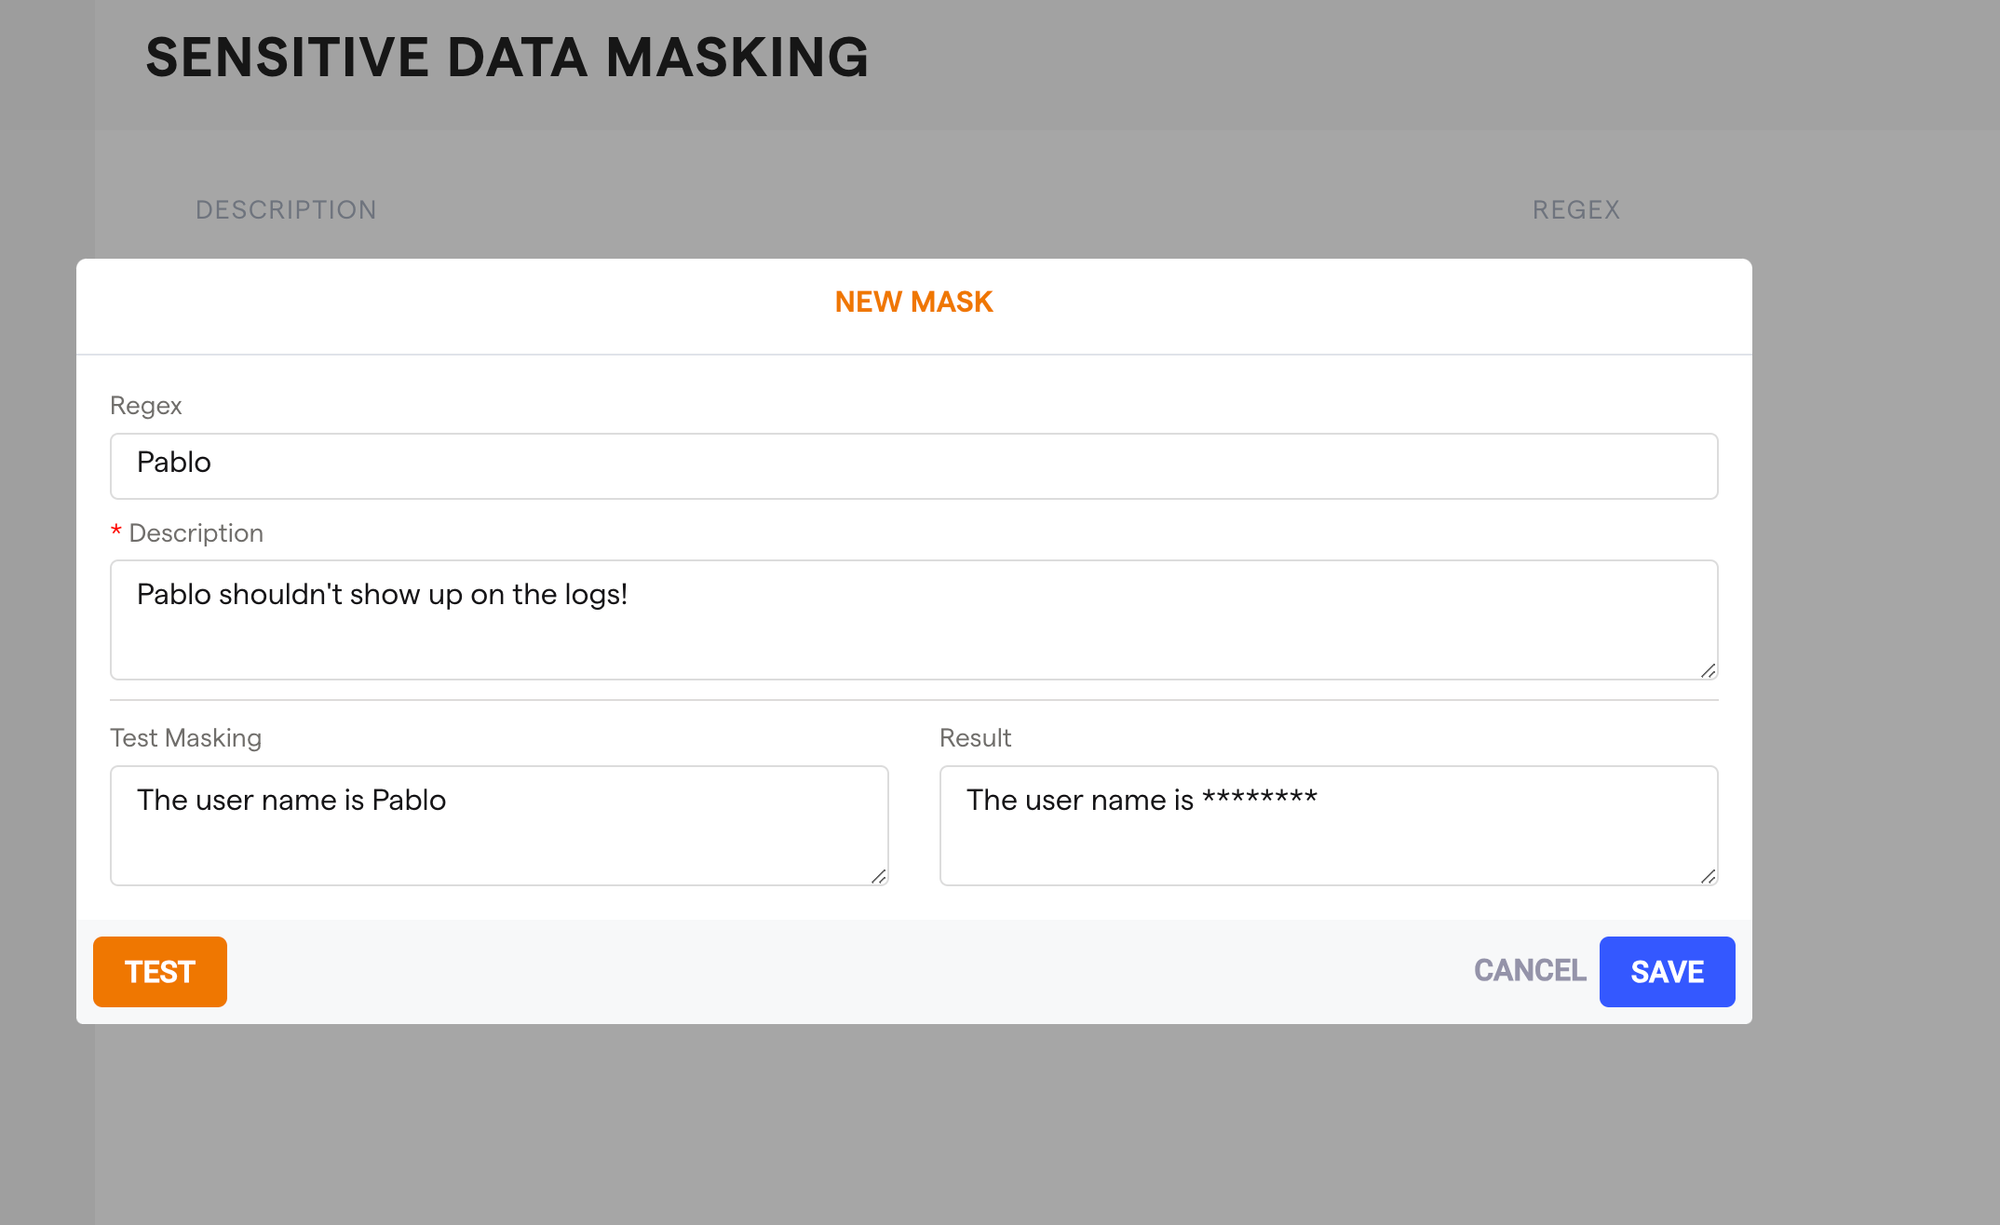
And as you can see, you are even able to test the regex on the fly without having to log dummy logs just to see if the rules are working as expected.
Nebula vs. Triton
The inevitable question is how does this logging framework compares to NebulaLogger. As I said earlier, Nebula Logger is super powerful and it’s a really good logging framework.
My perception is that Nebula is great for a team of devs that want robust logging framework capabilities as a way of troubleshooting. Triton feels more user friendly for a hybrid team (admins and devs) and it helps you actually take action on those logs by providing really good insights.
In the end, which one you go for is up to you. I recommend you try both of them and decide with your team which one feels like a better fit.
Conclusion
Overall, I found the user experience of Triton to be very good. As I said, I was able to breeze through the setup menu, configure a bunch of things and I never once looked at the docs.
If you’ve never done Apex logging, then I recommend you start with Triton because it just works.